Pen Plotters and Processing
Several years ago I wanted to escape some of my Processing sketches from the screen. I began exploring how I could use a vintage Hewlett Packard pen plotter to render some of my sketches on paper. I was attracted to the imperfect line quality created the machine and felt like the output was more interested then what is created by a standard printer. Here I detail my process and share some of the code I created.
Some Background
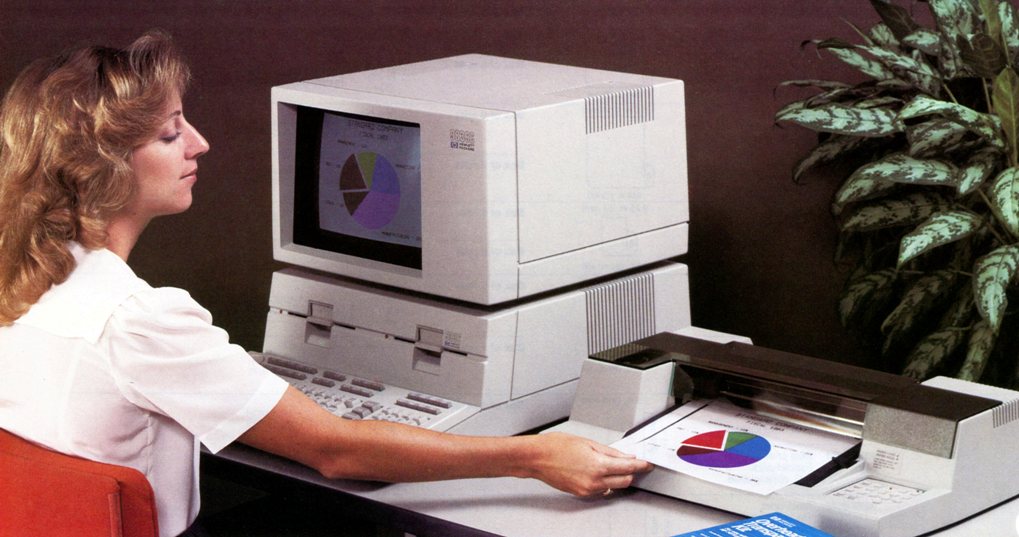
Hewlett Packard started manufacturing pen plotters in the 1970's. They work by moving a pen on a x/y axis, similar to how FDM 3D printers work today. Plotters were able to create very detailed drawings, around 1000 dots per inch (dpi). By comparison inkjet printers of the same era were doing 72 to 100 dpi. This made pen plotters were perfect for technical drawings. This site details the history of HP Pen Plotters.
HP plotters "speak" HPGL, Hewlett Packard Graphical Language. These are simple commands that would allow a computer to communicate with a plotter. Here is the documentation for HPGL.
Getting Started
I purchased a HP7475A from eBay. Made in 1983 so the plotter and I are essentially the same age. This plotter is desktop sized. It has pen carousel that holds 6 pens, so you can draw in different colors. It can plot on normal letter sized paper or 11x17" paper.
My first task was to figure out how to interface with the printer. While there were some projects like Chiplotle! that allowed communication between a computer a plotter. I wanted a way to control the plotter directly from Processing. I found this post from Tobias Toft that showed how to feed HPGL commands directly to the plotter through a serial connection. This was a very simple solution and great way to play around. But I didn't want to memorize all the HPGL commands so was looking to create something better.
Plotter Class
Inspired by Tobias Toft, I first created a plotter class that I could incorporate into sketches. The goals was to emulate processing commands for the plotter. For example, the command to draw a line in Processing is line(x1, y1, x2, y1)where the parameters are numbers for x,y pairs that represent pixel coordinates on the screen. I wanted to be able to write plotter.drawLine(x1, y1, x2, y2)and have the plotter draw a line at the same coordinates.
A tricky part is dealing with the coordinates. Processing sets 0,0 as the pixel in the top left corner of the screen and expresses all widths in pixels. The plotter uses points and doesn't start at zero because of paper margins, so a conversion must be made. I did this my letting know plotter class know the minimum and maximum locations for both x and y coordinates, then converting a pixel coordinate to a corresponding point coordinate that the plotter can use.
To keep it simple 1px gets scaled to 1 plotter unit where 1 plotter unit is 0.025mm
//sketch.pde,setings functhion
void settings(){
  // Set the paper size first, this allows the preview window to be in proportion
  // "A" = letter size, "B" = tabloid size, "A4" = metric A4, "A3" = metric A3
  setPaper("A");

  if(DEBUG) println("print dimensions", xMin, yMin, xMax, yMax);

  // Calculate the processing canvas size, proportional to paper size
  float screenWidth = (xMax - xMin)/scale;
  float screenHeight = (yMax - yMin)/scale;

  //set the canvas size depending on the paper size that will be used...
  size(int(screenWidth), int(screenHeight));
  if(DEBUG) println("screen dimensions", width, height);
}
Then I let the plotter class handle the math.
//Plotter class
//scale is set by sketch.pde
float convert(float value) { //convert pixel value to plot value
    return value * scale;
  }

  float convertX(float value) { //convert pixel x value to plot x value
    return convert(value)+xMin;
  }

  float convertY(float value) { //convert pixel y value to plot y value
    return convert(value)+yMin;
  }
Now, any of the drawing commands can take in a pixel value and convert it to a plotter point value.
//draw a single line, point to point
  void drawLine(float xStart, float yStart, float xEnd, float yEnd) {
    //build a statement string so that only one write needs to be made to the plotter
    //start the command, pen up, move to start location
    String statement = "PU" + convertX(xStart) + "," + convertY(yStart) + ";";

    //pen down, move to end location, put pen up
    statement += "PD" + convertX(xEnd) + "," + convertY(yEnd) + ";PU;";

    if(DEBUG) println(statement);
    write(statement); //send the statement to the plotter
  }
You can test this out by printing a 10px lines, which becomes 100 points and should be 2.5mm on the paper.
Once I had this worked out, a went about translating all the HPGL commands into Processing equivalents. You can access the code and an example here.
processing2hpgl Library
After making several drawings I found myself having multiple copies of my plotter class and got frustrated trying to remember which version was the version. So I decided to create a Processing Library so that I could simply import the functions to each new drawing sketch.
Here is the link to the class. Feel free to download, use, and contribute!
A Note on Pens
It is almost impossible to find pens to fit the HP pen plotters. Luckily, there is an open source solution! Here is a repository of OpenSCAD files so you can 3D print an adapter for common pen inserts. I contributed the Muji files.
You can cut the case of the plotter without harm to allow longer drawing materials to fit in the carousel.
